Forty years of business analytics winter!

The end of 2016 marked the end of my fortieth year in the computing industry. During the holiday hiatus I started thinking about all that has changed in forty years, but ended up thinking about that which has not.
I recall the early eighties, writing SAS proc tabulate routines for The Hay Group’s survey shop. Compared to to modern big data pipelines, massive parallel summarizers, columnar databases, and Tableau, the difference is … nothing of importance.
In fact, I would argue that the analyses we produced in the early eighties was more informative than most of what passes for business data analysis today.
Of course, all the plumbing and the languages and tools are different. And we don’t need a CalComp plotter to to do graphics. But fundamentally, most business data analysis is still tables, cross-tabs, and various graphical renditions thereof (or spreadsheets, pivot tables, and charts if you’re quite as old as me). Note I’m not saying there is nothing new, just that most business data analysis is the same old same-old.
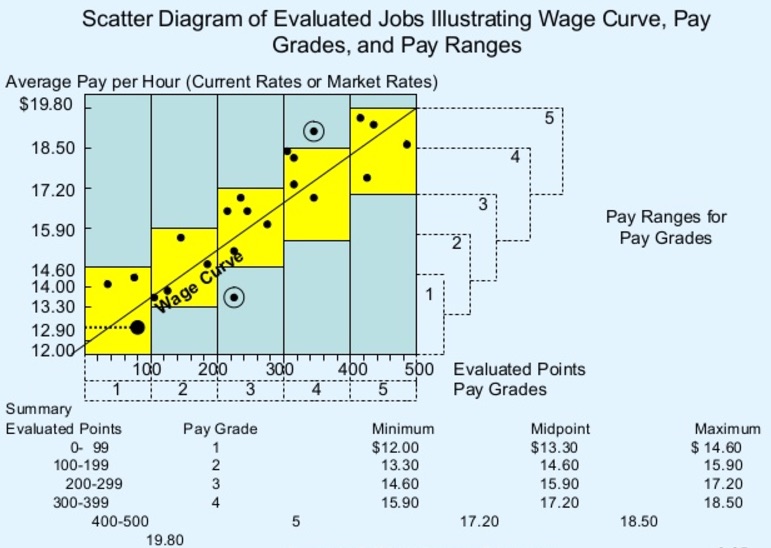 I don't have the CalComp plotter version, but this is more or less what we were doing in the eighties.
We can imagine several reasons why the advances weren’t more prominent:
Endlessly making the old stuff look new and shiny. Tree-maps, bubble-charts, and word-clouds are all just alternative renditions of cross-tabs and pie charts. So then what would qualify as advancement? How about presentations that incorporate distributions and uncertainty. The absence of these elements reflects unforgivable intellectual laziness on the part of both the producers and consumers of business data.
By the way, finance quants and digital advertisers do understand distributions and uncertainty (and machine learning and predictive analytics). That’s (at least in part) why digital ad revenue has grown at 17% CAGR since 2005 and the financial sector has been eating the rest of the economy since 1960.
Businesspeople didn’t advance much in their understanding and use of data. We know a lot more today about how uncertainty plays out, how to analyze it, how to characterize distributions, and how to draw significant inferences. And we also know a lot more about cognitive biases and how they affect our perceptions. Yet overall progress toward evidence and data driven business decision making has been measly.
The twenty-five years wasted on database technology! What? I didn’t say that, did I? Well … yes! Hey, databases are great, and they have innumerable benefits for record-keeping and transactional applications. But database vendors sold the idea that once everything was captured in the database (or data warehouse, or data marts, or data lake), all of the insight inherent in the data would leap out in a form easily consumed and exploited by business professionals.
select probability(next qtr sales is > 5% under forecast)
from ...
Dashboard obsession. Now and then a metaphor becomes malignant. The domino theory of the spread of communism comes to mind. And dashboards. No, dashboards probably haven’t killed people, but if we think about what might have been done with the effort that has gone into making useless dashboards, lives and livelihoods could certainly have been saved.
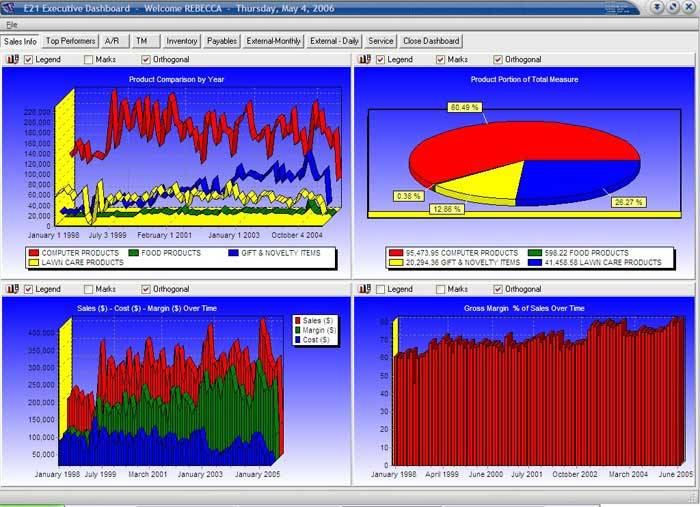
Automobile dashboards provide a realtime view of dynamic information that helps drivers make decisions. Most business dashboards provide out-of-date snapshots of information, the majority of which informs no decision-making. In other words, they are distractions, and the more effort that goes into their visual design, the more distracting they are.
But what about predictive analytics, machine learning, artificial intelligence, big data, Watson, TensorFlow, recommenders … ?
If you follow Andrew Ng and Hillary Mason, you might be led to believe business analytics is advancing nicely. But their job descriptions include promoting advanced analytics by describing successes and breakthroughs, of which there are many. I’m not suggesting there haven’t been advances. Quite the contrary, technology has advanced impressively, especially in the past couple of decades as the web giants have grown to corporate adulthood and achieved breakthroughs in machine learning. My point is that there is wonderful technology at hand and most companies aren’t using it.
Contrary to what the curmudgeon class of disaffected statisticians would like you to believe, it’s not hard. It requires a certain rigor, but no more than other engineering disciplines. Of course, the benefits depend on the problem to which it is applied, the availability of data, and a certain amount of luck. But for businesses, the upside is limitless, and the downside is extinction. You would think they would be clamoring to start projects. Why on earth not?
My theory is that forty years of gratuitous database and BI vaporware and hype has brought on profound analytical fatigue. The good news is that it will soon begin to lift. Analytics spring 2017! For a good many years, companies that have used analytics to their best advantage have shown demonstrable returns, But recently, the differential advantage has grown. Competitive advantages that move the needle a fraction of a percentage point benefit the largest players the most. Without scale, the cost can’t be justified. But when the lift jumps from a quarter of a percent to five percent, the disadvantage for non-adopters becomes an existential threat.
More on this and related topics as the year and the analytics spring progresses. Stay tuned!
|N|